Core Web Vitals Explained: Metrics, Thresholds, and Fixes
Core Web Vitals measure loading (LCP), responsiveness (INP), and visual stability (CLS) from real visitors. Learn the official thresholds, how to check your scores in Search Console and PageSpeed Insights, and how to fix a failed assessment, with clear limits on what these scores can and cannot do for SEO.

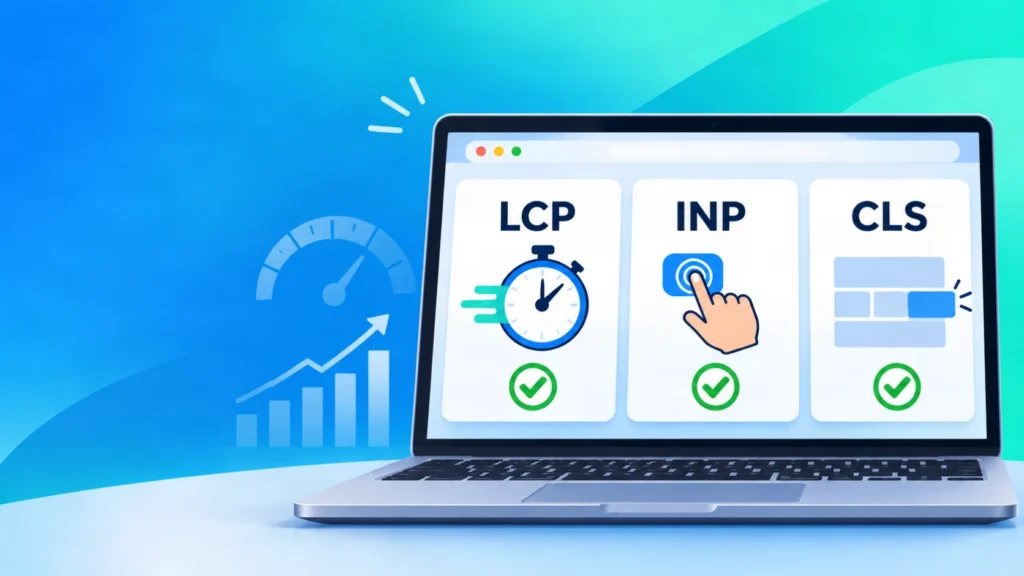
Core Web Vitals are Google’s three measurements of real-world page experience: how fast the main content loads, how quickly a page responds to a tap or click, and how stable the layout stays while people use it. This guide explains each metric, the pass and fail ranges, how to test your site, and what to fix first.
The three metrics are LCP (loading), INP (responsiveness), and CLS (visual stability). A page passes when at least 75% of visits reach the “good” range on all three: LCP of 2.5 seconds or less, INP of 200 milliseconds or less, and CLS of 0.1 or less. Google recommends good scores but says they do not guarantee top rankings.
About This Guide: Author Perspective, Sources, and Limits
This guide was written by Forkan Mahmud, an SEO consultant, and it explains Google’s published documentation and public datasets rather than original lab tests. I manage much of my work from Oman and work with SERP Panda. My core work covers Local SEO, Google Business Profile optimization, website structure, topical maps, content briefs, and content optimization, and I have around five years of experience with European clients.
I am not a Google employee, and I do not claim a performance engineering qualification. Every threshold and statistic below links to its source. Changes to page code, scripts, or server settings should be reviewed by a qualified web developer before they go live. I have not run a test for this article, so it contains no original benchmark results.
What Are Core Web Vitals?
These are three field metrics from Google that measure real-world user experience: loading performance, interactivity, and visual stability. Google Search Central states:
“We highly recommend site owners achieve good Core Web Vitals for success with Search”
Source: Google Search Central, “Understanding Core Web Vitals and Google search results”
They are called field metrics because they come from real visitors on real devices, not from one simulated test. That difference explains why your tool scores and your Search Console report sometimes disagree.
Which Three Metrics Make Up the Set?
The three metrics are Largest Contentful Paint (LCP), Interaction to Next Paint (INP), and Cumulative Layout Shift (CLS). According to web.dev, LCP covers loading, INP covers responsiveness, and CLS covers visual stability.
Each metric answers one visitor question. Did the main content show up? Did the page react when I tapped? Did the layout stay still while I read?
What Replaced FID in Google’s Page Experience Metrics?
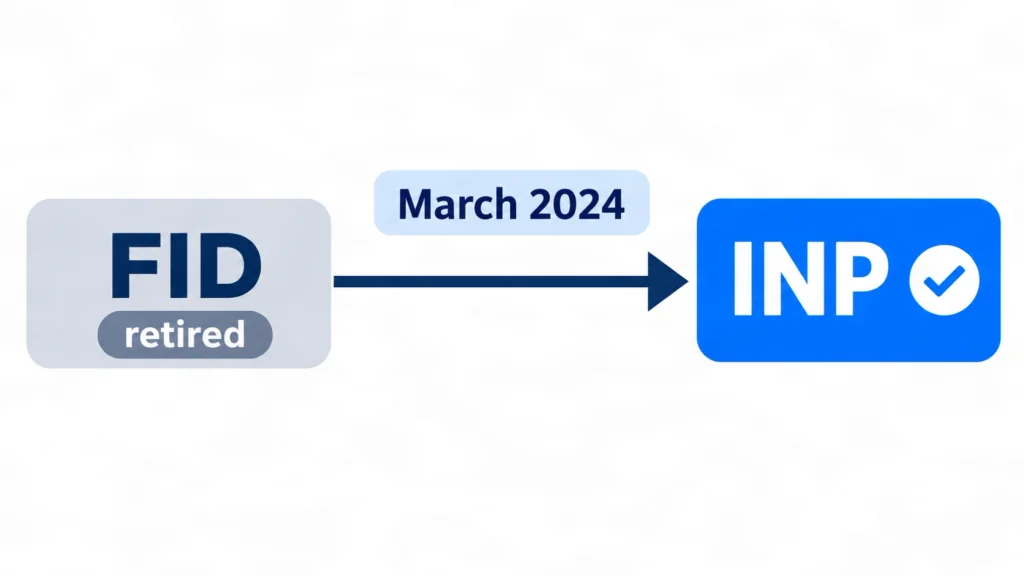
Interaction to Next Paint (INP) replaced First Input Delay (FID) on March 12, 2024. FID measured only the delay before the browser began handling a visitor’s first interaction. INP looks at interactions across the whole visit and reports one of the slowest.
Any guide that still lists FID as a current metric is out of date.
Good, Needs Improvement, and Poor: The Official Score Ranges
Google rates each metric as good, needs improvement, or poor, and a page passes only when it reaches “good” on all three. The ranges below follow the web.dev threshold documentation and the web.dev LCP guide.
| Metric | What it measures | Good | Needs improvement | Poor |
|---|---|---|---|---|
| LCP | Loading | 2.5 seconds or less | 2.5 to 4.0 seconds | Over 4.0 seconds |
| INP | Responsiveness | 200 ms or less | 200 to 500 ms | Over 500 ms |
| CLS | Visual stability | 0.1 or less | 0.1 to 0.25 | Over 0.25 |
Google can revise these numbers, so confirm them on web.dev before you treat them as permanent.
How Does the 75th Percentile Work?
The 75th percentile is the value that 75% of page visits meet or beat. In a simple example, if 80 out of 100 visits show the main content in 2.5 seconds or less, the page passes LCP, even though 20 visits were slower. This example is illustrative, not data from a real site.
The three metrics are not averaged. A page with fast LCP and INP but a CLS of 0.3 still fails. Mobile and desktop are reported separately, so a site can pass on one and fail on the other.
What Is LCP (Largest Contentful Paint)?
LCP measures how long the largest visible image or text block takes to appear after a visitor starts loading the page. On many pages this element is the hero image or the main heading. A good LCP is 2.5 seconds or less.
A common mistake is lazy-loading the hero image. Lazy loading helps images below the fold, but it delays the one image the browser should load first.
What Is INP (Interaction to Next Paint)?
INP measures how long a page takes to show a visual response after a click, tap, or key press, and it reports roughly the slowest interaction of the visit. A good INP is 200 milliseconds or less.
Slow INP usually comes from heavy JavaScript. Long tasks, bulky event handlers, and third-party scripts such as chat widgets and tag managers keep the browser busy when a visitor tries to interact.
What Is CLS (Cumulative Layout Shift)?
CLS measures how much visible content moves unexpectedly while a page loads or is used. The score has no unit, and a good CLS is 0.1 or less.
Typical causes include images without set dimensions, ads or embeds that load late, web fonts that swap and change text size, and banners that push content down after the page appears.
Which Metrics Are Not Part of the Set?
Total Blocking Time (TBT), First Contentful Paint (FCP), Time to Interactive (TTI), and Speed Index are supporting metrics, not official page experience metrics. Many search results blur this line, which causes confusion when a tool shows a red TBT on a page that passes.
- FCP marks when the first piece of content appears. LCP marks when the largest piece appears.
- TBT is a lab measurement of main-thread blocking. It can help explain a poor INP, but it is not INP.
- TTI is an older lab metric and is not part of the current set.
- FID was the previous responsiveness metric and has been retired.
Use these to find causes. Judge pass or fail only by LCP, INP, and CLS.
Field Data vs Lab Data: Why Scores Disagree
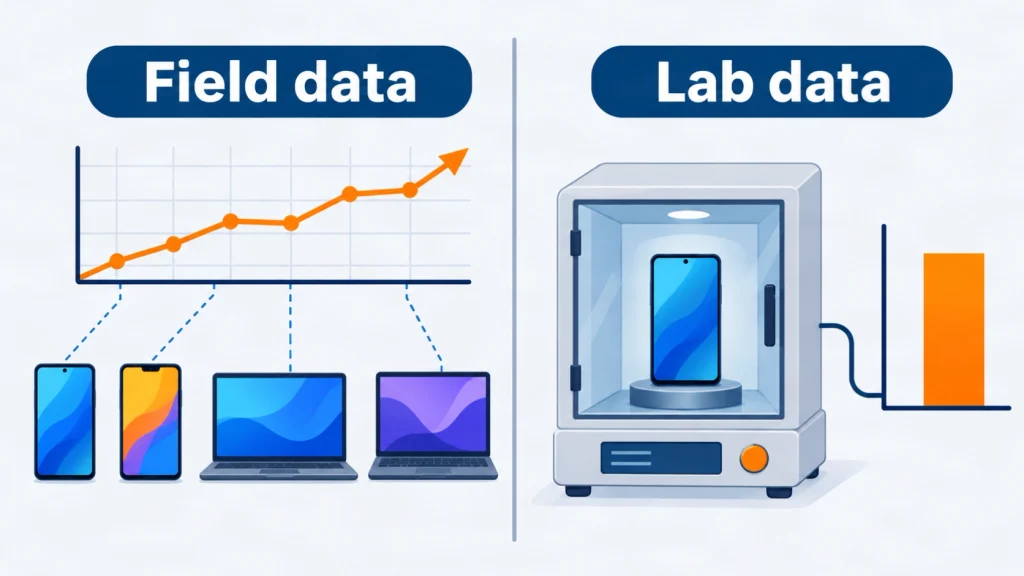
Field data records real visitors over time, while lab data comes from one simulated test, so the two often disagree. Google’s thresholds apply to field data.
| Source | Data type | Best use |
|---|---|---|
| Chrome User Experience Report (CrUX), a public dataset of real Chrome visits | Field | Official pass or fail status |
| Search Console report | Field | Finding failing URL groups |
| PageSpeed Insights (real-user section) | Field | Checking one URL or site |
| Lighthouse | Lab | Repeatable debugging |
| Chrome DevTools Performance panel | Lab | Tracing slow tasks and shifts |
CrUX includes only Chrome users who opted in to share usage data, so very small sites may have no field data at all.
What Is the Difference Between Lighthouse and These Metrics?
Lighthouse is a testing tool, the three metrics are the measurements, and PageSpeed Insights shows lab results and field data in one report. A Lighthouse performance score is not a pass or fail result, and a low Lighthouse score does not mean your real-user data fails.
When the two disagree, trust field data for pass or fail and use Lighthouse to find the cause. Google lists its measurement tools on web.dev.
How to Measure LCP, INP, and CLS on Your Site
Start with field data in Google Search Console, then use PageSpeed Insights and Chrome DevTools to find the cause. Follow these steps in order:
- Open the Core Web Vitals report in Search Console. It groups URLs by status for mobile and desktop.
- Pick one failing URL group and test a representative page in PageSpeed Insights. Read the real-user section first, then the lab results.
- Open the same page in Chrome DevTools and record a trace in the Performance panel to see the LCP element, tasks that block interactions, and layout shifts.
- Add Google’s open-source web-vitals JavaScript library to send real-user values to your analytics if you want your own monitoring.
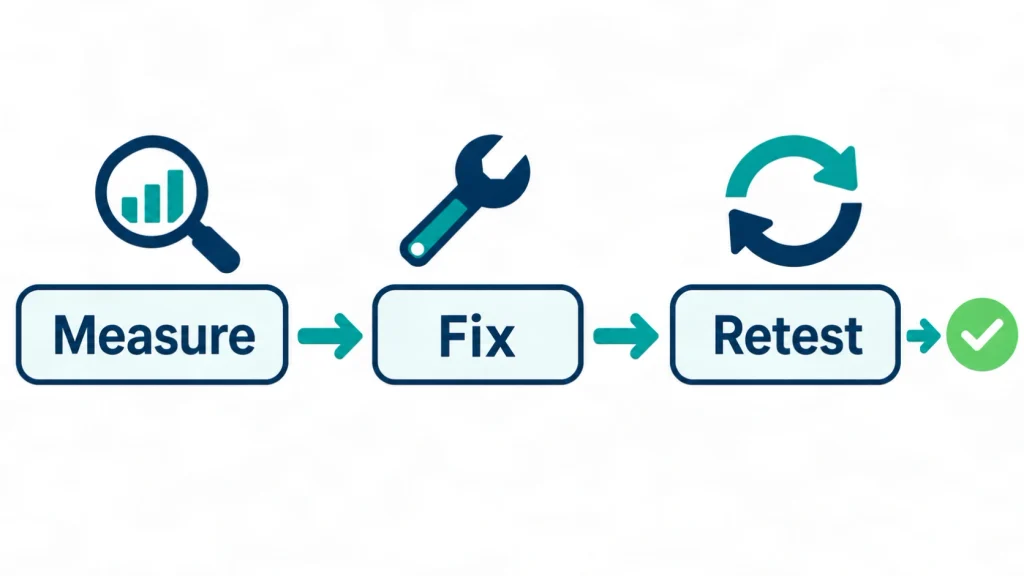
- Retest after each change, and wait for field data to catch up before you call a fix successful.
A Web Vitals browser extension can show live values for your own session. Treat those readings like lab data, since they reflect one device and one connection. For more audit topics, see my Technical SEO and Audit category.
Why Does the Assessment Say Failed?
The Core Web Vitals assessment shows “failed” when at least one of LCP, INP, or CLS misses the good threshold at the 75th percentile. Find the red metric first, then check whether the problem appears on mobile, desktop, or both. Also check whether the report covers one URL or the whole site, because one slow template can pull down a large group of pages.
Why Does My Report Show No Data?
“No data” usually means Chrome has not collected enough real-user visits for that URL or site. New and low-traffic pages often fall into this group. In that case, use site-level data if it exists, rely on lab tests for debugging, or collect your own real-user data with the web-vitals library.
How to Improve Core Web Vitals
Fix the failing metric first, because a page passes only when all three metrics are good. Improving a metric that already passes will not change the result.
The table below is my own working framework. It is built from Google’s guidance and is not a Google tool or a dataset.
| What the visitor notices | Likely metric | Common causes | First check |
|---|---|---|---|
| The main image or heading appears late | LCP | Large hero image, lazy-loaded hero, slow server | LCP element in PageSpeed Insights |
| A tap or click feels delayed | INP | Long JavaScript tasks, third-party tags | DevTools Performance trace |
| Text or buttons jump while reading | CLS | Unsized images, late embeds, font swaps | Layout shift regions in DevTools |
How to Improve LCP
Make the main content appear sooner by serving a smaller hero image, loading it first, and removing delays before the browser can render it.
- Compress the hero image and use a modern format.
- Do not lazy-load the LCP image, and consider preloading it.
- Reduce server response time with caching or a content delivery network.
- Remove or defer CSS and JavaScript that blocks rendering.
Google’s Optimize LCP guide splits LCP into stages so you can see which stage is slow. Online stores with large product images often meet this problem first, which is a common concern in e-commerce projects.
How to Improve INP
Reduce main-thread work so the browser can paint soon after each interaction. The Optimize INP guide covers the details. In practice:
- Break long JavaScript tasks into smaller ones.
- Defer scripts that are not needed for the first interaction.
- Review third-party tags and remove the ones that add little value.
- Keep click and input handlers light.
- In React apps, avoid re-rendering large component trees after a small state change.
How to Improve CLS
Reserve space for everything that loads late. Set width and height on images, iframes, and videos. Give ad slots, embeds, and cookie banners a fixed area. Avoid inserting content above what the visitor is already reading, and load key fonts early so text does not jump when the font swaps.
WordPress Fixes for LCP, INP, and CLS
On WordPress, start with hosting quality, caching, image size, and the weight of your theme and plugins. Page builders and plugins that load scripts on every page are frequent causes of poor INP and LCP.
Change one thing at a time and retest, so you know which change helped. Template structure also affects layout stability, which I cover in my Web Design and Architecture category.
Do Core Web Vitals Affect SEO?
Yes, but modestly: Google says its ranking systems use these metrics as part of page experience, while relevant content still matters more. Google’s page experience documentation says good results in Search Console or third-party reports do not guarantee top rankings, and that chasing a perfect score only for SEO may not be the best use of your time.
Google’s own FAQ is direct about priorities. Search Engine Roundtable reported this Google statement:
“A good page experience doesn’t override having great, relevant content.”
Source: Google Core Web Vitals and Page Experience FAQ, as reported by Search Engine Roundtable, March 31, 2021
Page experience matters more when many pages offer similar helpful content, according to Google’s 2023 Search Central post. That is the situation in many competitive search results.
From my work on website structure and content optimization, I treat these metrics as a supporting layer. Structure and content decide whether a page deserves to rank, and page experience decides whether the visitor stays. This is my professional view, not a Google statement, and no one can promise a ranking gain from fixing these metrics.
Page Experience Statistics Worth Knowing
About half of websites pass all three Core Web Vitals metrics: 48% of mobile origins and 56% of desktop origins. The figures below come from the 2025 HTTP Archive Web Almanac, which analyzes Chrome User Experience Report field data from July 2025.
- Overall pass rate: 48% of mobile and 56% of desktop origins passed all three metrics. An origin is a whole website, not a single page.
- Mobile pass rate by metric: 62% good LCP, 77% good INP, and 81% good CLS, as reported in published summaries of the same chapter.
- What this suggests: LCP is the most common reason mobile sites fail. This reading is my inference from the numbers, not a finding stated by HTTP Archive.
These figures measure the share of sites, not traffic or business results. Use them as a benchmark, not a target.
A Practical Audit Checklist
A good audit moves from field data to cause to fix to retest. Use this checklist:
- Open the Search Console report and note which metric fails on mobile and desktop.
- List the failing URL groups, such as product pages or blog posts.
- Test one page per group in PageSpeed Insights.
- Identify the LCP element and confirm it is not lazy-loaded.
- Record a DevTools trace and look for long tasks near interactions.
- Find layout shifts and the elements that cause them.
- Remove or defer scripts that add little value.
- Retest, then monitor field data for several weeks.
This checklist is a working routine. It is not a Google metric or a score.
Risks, Limits, and Next Steps
Core Web Vitals scores guide improvements, but they do not guarantee rankings, traffic, or sales. Google also notes that other page experience factors do not directly raise rankings on their own.
- Delay: Field data covers a rolling window of recent visits, so improvements take weeks to appear in reports.
- Variation: Results differ by device, network, and country.
- Breakage risk: Code changes can break layouts or features. Test on a staging copy and keep a backup before editing a live site.
- Change: Google may revise the metrics or thresholds, so check web.dev from time to time.
- Scope: This guide covers the three metrics and common fixes. It does not replace a developer review of your specific code.
Your next step is simple: open Search Console, find the worst failing metric, and fix that one first. You can read more about my background on the About page.
When Should You Hire a Performance Specialist?
Consider outside help when the failing metric traces to theme code, third-party scripts, or server settings that you cannot change safely. A specialist can read traces, test fixes on staging, and explain trade-offs, such as removing a script that your marketing team relies on.
If you want to see how page experience fits your wider plan, you can explore my website SEO service or my web design service. You can also contact me with your Search Console findings.
Conclusion: What to Remember
Core Web Vitals measure loading, responsiveness, and visual stability from real visitors, and a page passes only when all three are good at the 75th percentile. Use field data to decide pass or fail, use lab tools to find causes, and fix one metric at a time. Treat good scores as a better experience for visitors, with a possible small benefit in search, not a guarantee.
Frequently Asked Questions
1. What are the core web vitals?
They are three Google metrics: Largest Contentful Paint for loading, Interaction to Next Paint for responsiveness, and Cumulative Layout Shift for visual stability. Together they describe how a page feels to real visitors.
2. How many Core Web Vitals are there?
There are three: LCP, INP, and CLS. INP replaced FID in March 2024, so FID is no longer part of the set.
3. What is a good Core Web Vitals score?
A good score means LCP of 2.5 seconds or less, INP of 200 milliseconds or less, and CLS of 0.1 or less, measured at the 75th percentile of real visits.
4. Is Core Web Vitals a ranking factor?
Google says its ranking systems use these metrics as part of page experience, but relevant content still comes first. Good scores do not guarantee top positions.
5. How do I check my scores?
Use the Search Console report for field data. Then test individual pages in PageSpeed Insights and Chrome DevTools to find the causes.
6. Why did my Core Web Vitals assessment fail?
At least one metric missed the good threshold at the 75th percentile. Identify the red metric, check mobile and desktop separately, and fix that metric first.
7. What is the difference between Lighthouse and these metrics?
Lighthouse is a lab testing tool, while LCP, INP, and CLS are field metrics. A Lighthouse performance score is not the same as a pass or fail assessment.
8. What replaced FID?
Interaction to Next Paint replaced First Input Delay on March 12, 2024. INP considers interactions across the whole visit, not only the first one.
9. How long do improvements take to show?
Field reports use recent visit data, so changes usually take several weeks to appear fully. Lab tests show changes immediately but do not prove real-user improvement.
10. Do I need to pass on both mobile and desktop?
Google reports them separately, so a site can pass on one and fail on the other. Fix mobile first if most of your visitors use phones.